Loading files
This file is pinned to the selected release. Download the original to open it in your design tool.
# Purpose
Scripts for analyzing and visualizing radiation measurement data from ionization chamber sensor.
# Content
## Single Sample Analysis (radiation_analysis_single.R)
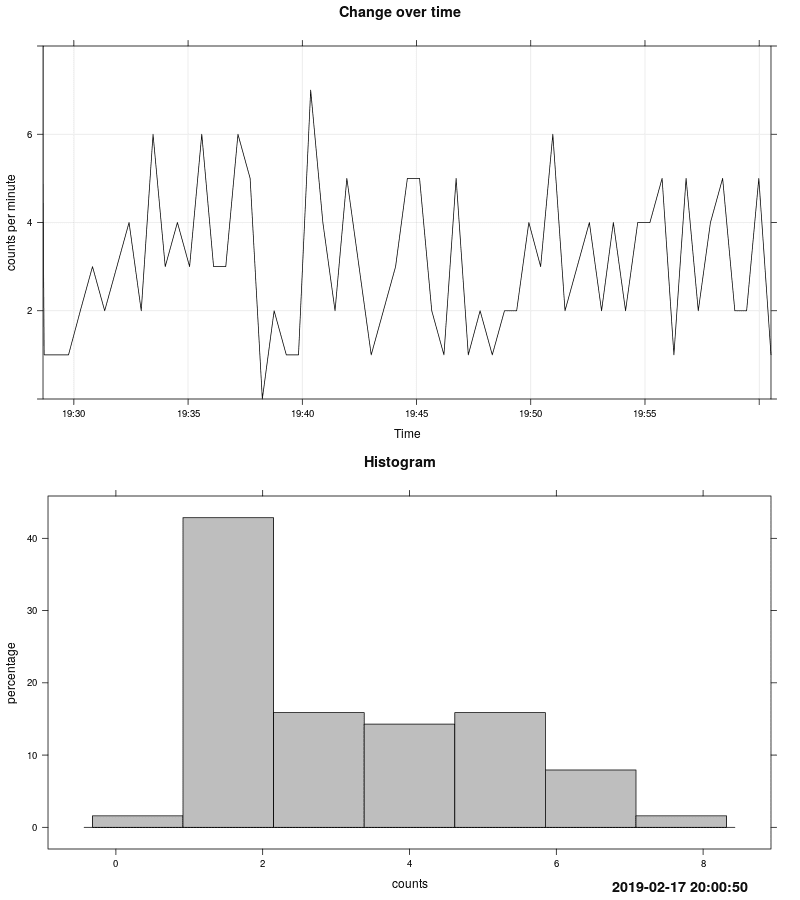
#### Purpose:
Analyzes a single radiation sample, producing:
Time series plot of radiation counts
Histogram of radiation distribution
#### Input
A CSV file (data.csv) with two columns:
Time: Timestamps in %Y-%m-%d %H:%M:%S.%OS format
Voltage: Measured voltage from ionization chamber
#### Output
Two image files (PNG and SVG) with the filename pattern:
radiation_analysis_single_<timestamp>.<ext>
#### Usage
Place your data in data.csv in the same directory
Run the script:
Rscript radiation_analysis_single.R
## Multi-Sample Comparison (radiation_analysis_multi.R)
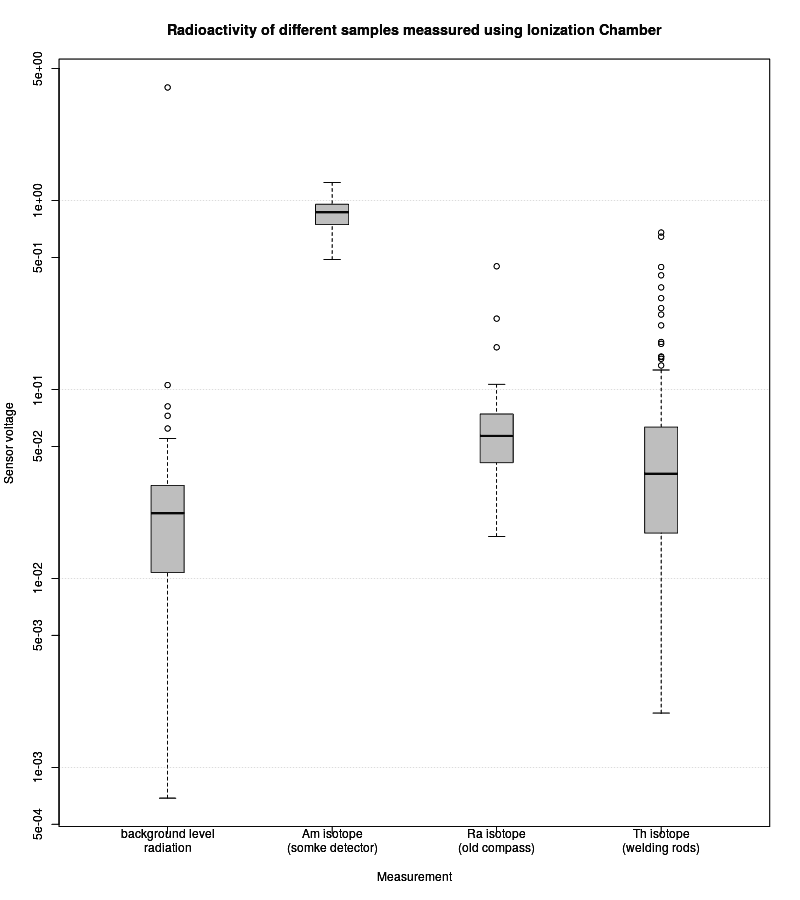
#### Purpose
Compares radiation levels across multiple samples using boxplots.
#### Input
Multiple CSV files (configured in the script) each containing:
Time: Timestamps (optional, used for footer)
Voltage: Radiation counts (required)
#### Output
Two image files (PNG and SVG) with the pattern:
radiation_comparison_<timestamp>.<ext>
#### Usage
Configure samples in the radiation_analysis_multi.R script (search for line shown below)
samples <- list(
background = list(file = "DataNoSample.csv", name = "Background Radiation"),
americium = list(file = "DataSample1.csv", name = "Am-241 (Smoke Detector)"),
radium = list(file = "DataSample2.csv", name = "Ra-226 (Old Compass)")
)
Run the script:
Rscript radiation_analysis_multi.R
b1cc3914aThis file is pinned to the selected release. Download the original to open it in your design tool.